26Nov
2016
Eugene / Learning, Stanford Machine Learning / 0 comment
Plotting Data (Octave)
1. t=[0:0.01:0.98]
$t=\begin{pmatrix}
0 & 0.01 & 0.02 & … & 0.98
\end{pmatrix}$
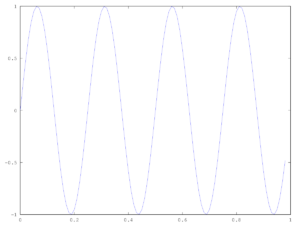
2. y1 = sin(2*pi*4*t)
plot(t,y1)

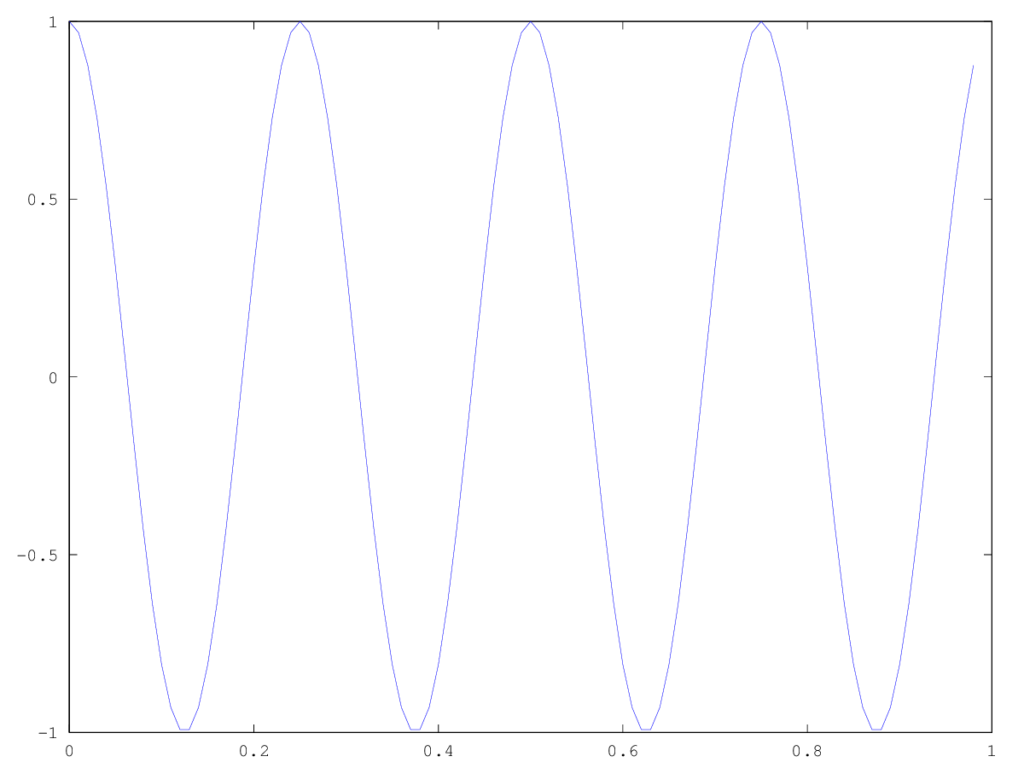
3. y2 = cos(2*pi*4*t)
plot(t,y2)

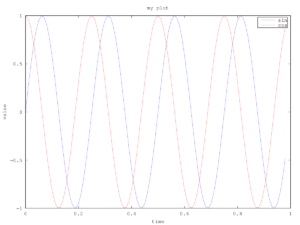
4. plot(t,y1);
hold on;
plot(t,y2,'r');
xlabel('time')
ylabel('value')
legend('sin','cos')
title('my plot')

